Vehicle diagnostics became much easier upon the release of OBD II. The technology improved on the original On-Board Diagnostics, or OBD 1, that were used previously.
Following its release in 1994, vehicle manufacturers started to turn to this particular type of computerized system. By 1996, the United States demanded that all vehicles manufactured from the current year onward need to contain the newer OBD II diagnostics system.
The use of OBD II technology is not only limited to mechanics and garages. There are several OBD II scanners on the market that makes it possible for the average individual to obtain diagnostic data for their vehicle.
The scan tool has several benefits to offer, with some even providing live data. In this post, we’ll go over the basics of how live data works in an OBD2 scanner. We also share a few tips to help you understand how to read this data and interpret it.
How Does The OBD2 Technology Work?

Before we look at the live data presented by a scan tool that plugs into the OBD II port, we should first consider how the technology works. This will give you a better idea on what to expect, as well as to establish the accuracy.
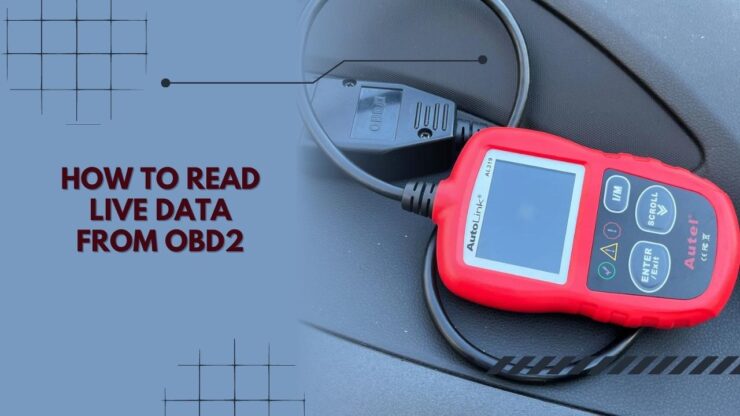
An OBD2 scanner connects to a port located on your car’s dashboard. The specific location of the OBD II port differs from one car to the next, but the design of the port itself remains similar. The port connects to a computer system that is built into the car.
The On-Board Diagnostic system actually expands to many areas of your vehicle. In addition to the port and the computer, the system also consists of many sensors. These sensors form a complete network throughout the car. Each of the sensors reports back to the computer system that is part of the On-Board Diagnostics technology used in the car.
Due to the distribution of the sensors throughout the vehicle’s structure, it is possible to obtain different types of data. The specific data that can be read depends on the OBD2 scanner you decide to use.
Some of these devices are only made to be used when the check engine light is on. This means the scan tool will only have the purpose of providing you with error codes submitted by the engine.
A scan tool that gives you access to live data, however, can usually give you more details to work with. These tools can be used when the check engine light is on. Additionally, they can also be used as a way of determining the overall performance of the vehicle.
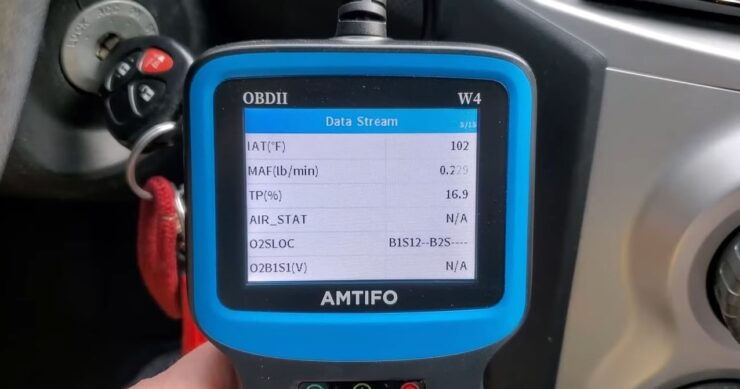
Some of the live data that an OBD2 scanner may provide you with include:
- Engine RPM reading
- Intake air temperature
- Short-term fuel trim
- Long-term fuel trim
- Throttle position
- Engine coolant temperature
- Air fuel mixture
Of course, this is a limited list of live data that you can obtain. These scan tools usually come with additional capabilities to ensure you can pick up even small issues with your vehicle. When you use the live data provided by the scan tools, you can diagnose a problem early – which can help you prevent complications.
Understanding OBD2 Live Data Codes
There are several codes that can display on an OBD2 scanner once it syncs with your car. Each code is related to specific parts of the vehicle and provides data submitted by the sensor network.
In this section, we will take a look at some of the more common codes and the related data. A thorough understanding of live data codes can help make the diagnostics process more efficient.
Oxygen Sensor
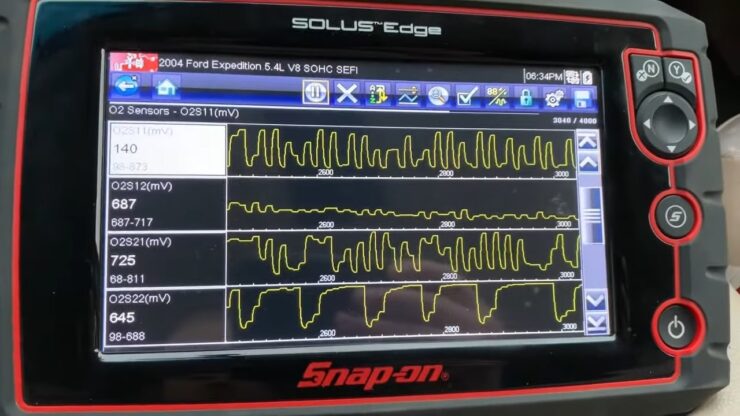
When reading live data, you’ll be able to see the voltage of the oxygen sensor. This particular sensor is responsible for data relating to the air-fuel ratio in the exhaust.
By delivering the sensor data to the engine, automatic adjustments are made to provide an efficient driving performance. The voltage of the oxygen sensor tells you how efficient the current ratio between air and fuel is in the exhaust. In most cases, the appropriate voltage will be about 0.5 volts, but this can fluctuate a bit.
Fuel Trim
Your car has an engine control module, sometimes referred to as an ECM, that delivers fuel from the tank toward the engine. This system is also responsible for regulating the mixture between air and fuel.
It plays a role in the regulation of the emission control system as well. You’ll usually see two readings for fuel trim. This includes Long Term Fuel Trim and Short Term Fuel Trim. The codes used to describe these are usually LTFT and STFT.
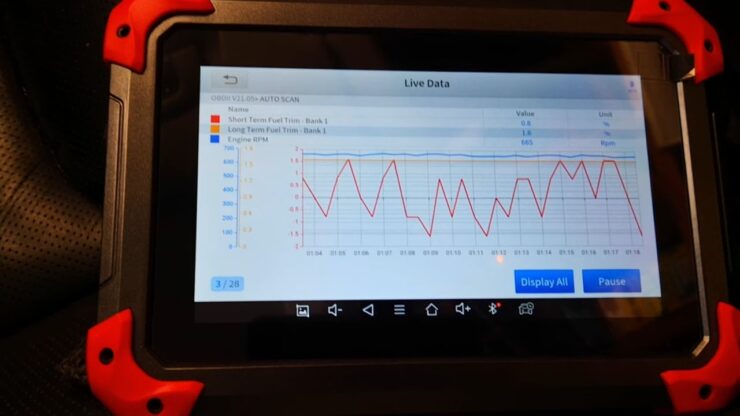
This particular reading tells you whether the ECM is currently adding more fuel or air to the mixture. When the reading is above 0%, it means more fuel is added. On the other hand, when the reading is below 0%, then fuel is removed and more air is added.
The ideal STFT reading should be between 10% and -10%. You should look at the LTFT reading more strictly – the range shouldn’t go below -5% or above 5%. While keeping an eye on this live data, the STFT reading should be consistently shifting between positive and negative percentages.
This is due to the activity of the ECM. On the other hand, you should see a more stable figure when looking at the LTFT reading.
Readings that are above or below these indicated ranges usually mean problems with the fuel delivery system in your vehicle, or the engine itself. Vacuum leaks are also able to cause alterations to the readings of both STFT and LTFT. In this particular case, the fuel trim level will be much higher than it should be.
Temperatures
A high-quality OBD II scan tool should be able to provide you with the temperature at specific points. This includes the intake air temperature, as well as the engine coolant temperature.
The IAT sensor constantly checks the temperature of air that moves toward the engine. The data is sent back to the ECM, which assists with the air-fuel mixture process.
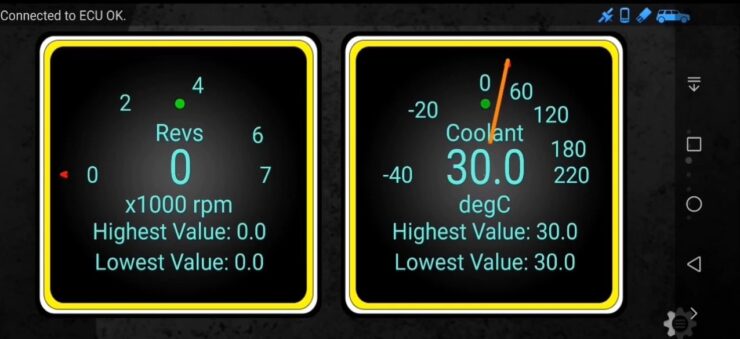
This is important since the density of hot and cold air differ. Thus, if there is a change in temperature, then the ratio in the mixture process needs to change. When looking at the engine coolant temperature, the ideal range would be anywhere from 190 degrees Fahrenheit to 220 degrees Fahrenheit.
When the temperature of the engine coolant declines to a lower degree, then the ECM will respond by adding more fuel to the mixture. This will also cause the ECM to start raising your car’s idle speed.
How Do I Read Live Data From OBD II?
The specific process for diagnosing problems with a vehicle using the OBD II data depends on the device you decide to use. It is also important to understand how the device works. A good starting point is to take a look at the manufacturer’s instruction manual that comes with the OBD2 scanner.
Even though these devices may look similar to each other, the specific usage instructions may slightly differ between multiple options. When looking at how to use the OBD2 scanner, start by considering whether you have a portable one or an option with its own display.
Many people prefer the portable options as they come with wireless technology and allow you to store reports on a connected device. The device will usually feature Bluetooth technology.
To start using it, you’ll need to download an application on your smartphone. Some devices are universal and can be used with different apps. There are, however, certain options that use specific apps that are made by the brand.
An example of such a device is the Fixd App system. Make sure you check the manufacturer’s instructions. This will usually give you a better idea on the apps that are compatible with the device.
A few of the top-rated universal apps that are supported by many OBD2 scanner products include:
- Torque Pro
- OBD Auto Doctor
- InCarDoc Pro
- EOBD Facile
- HobDrive
- Dash
- OBDeleven
Some of these are paid apps, such as Torque Pro. The paid versions generally provide you with more functions that you can use when diagnosing problems in your car.
The usage of the app depends on the specific one that you decide to download. You will need to ensure your smartphone’s Bluetooth is turned on. In most cases, the app you use will help you sync your smartphone with the scanner. You will need to turn the ignition on your car to “drive” before attempting to pair the device with your smartphone. This is because the device relies on your car as a power source.
Follow the instructions provided by the app to initiate the sync. Once connected, you’ll be presented with live data that is collected from the sensor network in your car. Most apps will give you a dashboard that shows the most important data – such as fuel mixture, short-term fuel trim, and data from the oxygen sensor.
You can also usually customize the dashboard to be more suitable for your specific need. The OBD2 scanner can also obtain data from your car, such as the fuel system used, which is taken into consideration when displaying potential fixes.
How To Read And Interpret live Sensor Data?
The method used to read the live sensor data largely depends on the app that you installed. If you connect to the scanner after the check engine light comes on, then the app will likely display a message, along with some codes. Each code is related to a fault detected by sensors in the car.
Some apps will give you data related to each of the codes displayed. This makes the process of interpreting live sensor data significantly easier. With certain apps, you will be presented with the specific sensor that gave the code as well – such as the oxygen sensor or the sensors that read absolute pressure in your vehicle.
If the app only gives you codes, then you may need to look them up on the internet or on a different mobile app. Once you identify the meaning behind each code, you’ll have a better understanding of why your vehicle is experiencing certain problems.
Benefits Of Live Engine Sensor Data
Live data from the engine can offer you multiple advantages. It is important to understand the benefits, especially when comparing scanners that provide live data to those that only offer fault codes.
The main factor that we need to consider here is that simply being able to see an error code may not mean much. Perhaps you get an error code regarding air fuel or problems with the coolant temperature. While the code is useful, it can still take a lot of diagnostic processes to determine the specific issue. Perhaps there is a broken part that needs to be replaced, or maybe it is a simpler fix.
This is where the benefits of a live engine sensor come into play. When you are presented with live data in addition to the fault codes, diagnostics become significantly easier.
You can focus on data from specific factors that play a role in the error code displayed. This helps you cancel out the possibility that specific parts are not functioning properly. It also allows you to find the specific part that needs your attention.
Another benefit is that the majority of live data scanners are capable of clearing current error codes on the built-in On-Board Diagnostics system in your car. When you clear the current fault codes that are stored in the memory of the OBD II system, you can start the car and wait for the check engine light to come on again.
Once on, new codes that are more relevant are reported – and, at the same time, you have a chance to see the live data related to the performance of your engine as the light comes on. This not only makes the diagnostics process easier, but also adds to the overall accuracy you get.
You can easily end up saving a significant amount of money with this type of data. Let’s consider an example scenario to help you better understand how an OBD2 scanner can save you money. You find that the check engine light comes on. This means it is time to connect to the scanner and check for fault codes. The fault codes tell you that there is a problem with a specific sensor in your car. The first thought here is to buy a new sensor.
By clearing the fault codes, setting up the live data, and then starting your car – you get new fault codes, as well as some valuable data that helps you identify problems with the surrounding areas too.
After reading all the data and doing a manual check on the parts, you discover that loose wiring is the cause behind the malfunctioning sensor. Reconnecting the wires restores the functions of the sensor and helps you clear the fault code – with no purchase of a new sensor necessary. Of course, this is just one example of a scenario – and each individual will have their own experiences when using an OBD2 scanner to diagnose problems with their vehicle.
Also Read: Best OBD2 Splitter
Conclusion
OBD II technology allows you to get diagnostics data when the check engine light comes on. With the ability to display live data, you can effectively diagnose problems – making the process of getting the right repair easier.
For people who use an OBD2 scanner for the first time, the data presented may feel a bit confusing. Whether testing for long-term fuel trim, intake air temperature, or other data – understanding what the information provided means is important. Take the tips we shared into account to help you make the most out of the live data presented by your scan tool.